You load one half-hourly file per meter. The analyser checks the readings, applies the right calendar for each building (24/7 for inpatient sites, set hours for clinics and offices), measures base load and peaks, prices the patterns at your rates, tests headroom for new load such as heat pumps, and estimates how much solar each site would use. It runs in your browser, so the meter data never leaves your computer.
1. Loading the meter files
Each file becomes a site. Most trusts and health boards have a file per main meter, and some have sub-meters for theatres, outpatients or an energy centre too. Excel (.xlsx, .xls) and CSV both work, in any of the three layouts suppliers and monitoring systems use: one day per row with 48 readings, one day per column, or one timestamped reading per row. The analyser shows how it read each file, including whether readings were kWh or kW and what it ignored. Files longer than a year are analysed over the last 12 months by default, while the trend charts use everything.
Meters behind the same connection, such as two incomers on one hospital, can be grouped so capacity is checked against their combined demand.
2. Checking the readings first
Bad data makes confident-looking wrong answers, so the checks come before any figures:
- missing half hours are left out, never treated as zero
- whole days of zeros, and two-hour runs of exact zeros inside normal days, are flagged as likely data faults
- the two clock-change days and any duplicate dates are held back for you to review
- isolated spikes far above the normal peak are listed
Each site gets a Good, Check or Poor rating. You can exclude readings you know are wrong, with a note of why, and the note stays with the analysis.
3. The right calendar for each building
New sites start on the hospital preset: open around the clock, with 01:00 to 05:00 as a low-activity window in place of closed hours. Change health centres, outpatient buildings and offices to the clinic or office preset, then add evening clinics, Saturday sessions and closures. The calendar is marked unconfirmed until you check it, and findings that depend on it carry lower confidence until you do.
4. Base load, and use while closed
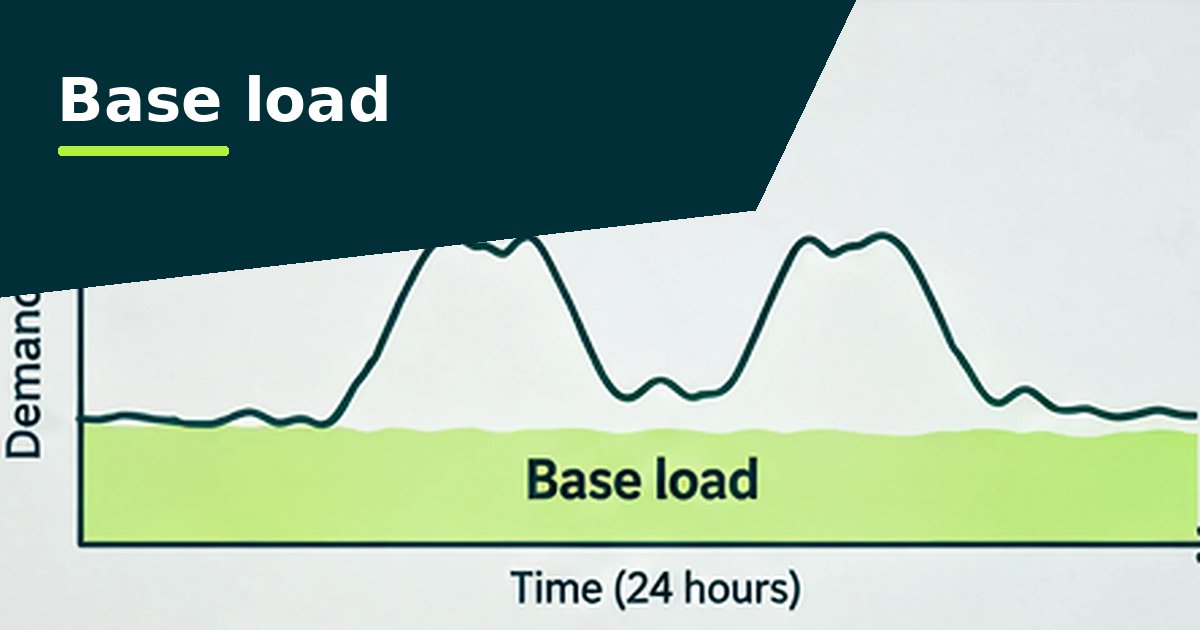
Base load is the 5th percentile of valid half-hourly demand: the level the site stays above 95% of the time. On a hospital that's wards, ventilation, imaging, fridges and IT; it's usually the largest part of the bill. The analyser also charts it month by month, because a step that doesn't follow the weather is often a fault, such as a theatre ventilation setback that stopped working. See base load on healthcare sites.
Closed-hours excess applies to buildings that close. It's the electricity used outside opening hours above the base load, priced at your rates and split by weeknights, Saturdays, Sundays and bank holidays. Buildings are ranked by it, so the worst health centre gets looked at first. See out-of-hours use.
5. Costs and annual figures
Costs use the unit rates you enter, flat or by time of day, and leave out standing, capacity and other fixed charges. They're what a pattern costs now, not a promised saving. Annual figures are scaled from the valid hours: marked indicative below about 11 months of good data, and withheld below six.
6. Findings, impact and confidence
Every finding carries two ratings. Impact reflects its cost and share of use. Confidence reflects the data quality, how many comparable days there were and whether the calendar is confirmed. High impact with low confidence means check before you quote it to the board.
7. Capacity and headroom
Enter the agreed supply capacity in kVA from the bill and a power factor (0.95 if you don't know it). The analyser compares every half hour with it, keeps a safety margin, and reports the firm headroom: the constant extra load that fits in every half hour. You can then test a specific load, such as a 150 kW heat pump running October to April or EV chargers in the evening, and see how many half hours it would breach. It's an early screen; only the DNO can confirm capacity. See supply capacity and headroom.
8. Solar
The Solar tab overlays a typical UK solar day, scaled to your region, on the site's own readings to estimate how much of a system's output the site would use at a dozen sizes. Size solar for this site opens the solar calculator with that summary, so you can draw the roofs and car parks and see cost, savings and payback. The readings themselves are never passed. See sizing solar from half-hourly data.
What it can't tell you
- A main meter shows when electricity is used, not which plant uses it. Findings are things to check on site.
- Import meters miss what a CHP engine or solar supplies. Load the generation meter as its own file to see total demand.
- Gas and heat aren't analysed yet, and figures aren't weather-adjusted.
- Carbon uses one conversion factor for the year, which you choose.