This hospital spends about £211,000 a year on load that never switches off, and from September that load jumped by about 22 kW when the theatre ventilation stopped setting back at night. Fixing it is worth roughly £31,000 a year. The supply has room for a 100 kW heat pump through the winter but not a 150 kW one, and the site would use almost every unit from a solar system of up to about 300 kWp.
The site
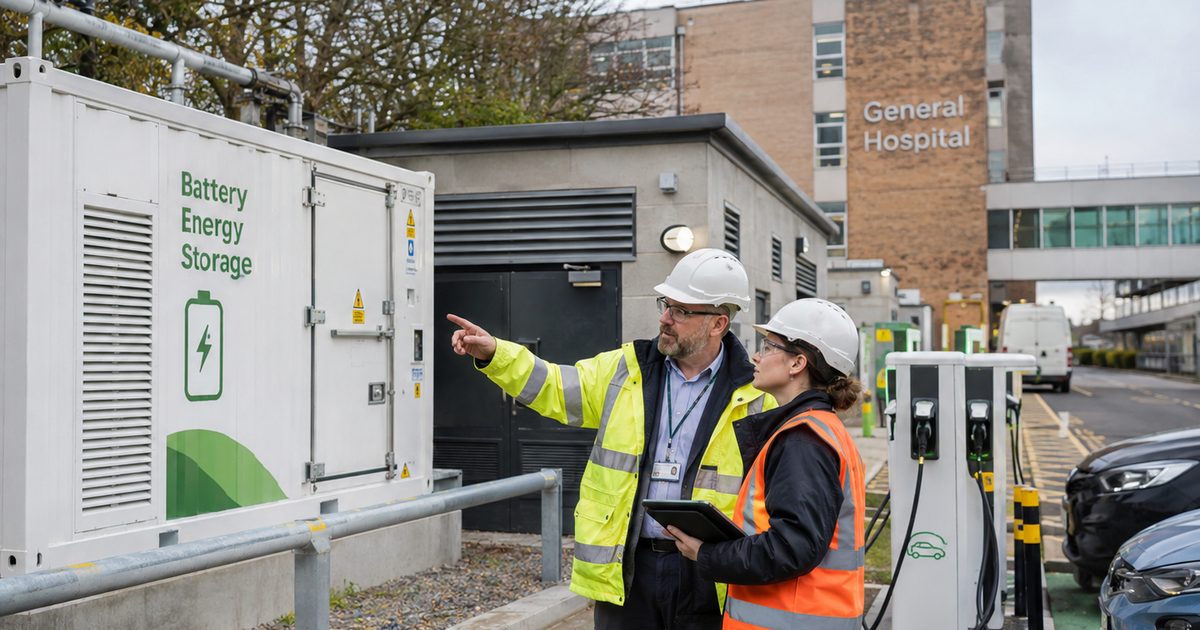
A community hospital with 60 inpatient beds, an outpatients wing and two day-surgery theatres, on one half-hourly meter. Wards, kitchens, IT and ventilation run around the clock. Outpatients and theatres run 08:00 to 18:00 on weekdays. Chillers add load on summer afternoons. The standby generators are tested on load for an hour on the first Tuesday of each month, which takes the site off the grid while they run.
The headline figures
| Measure | Value | What it means |
|---|---|---|
| Electricity a year | 1,350,066 kWh | Scaled from 363 days of valid readings (99.5% coverage). The two clock-change days are held back. |
| Energy cost a year | £337,517 | At a flat 25p/kWh, before standing and capacity charges |
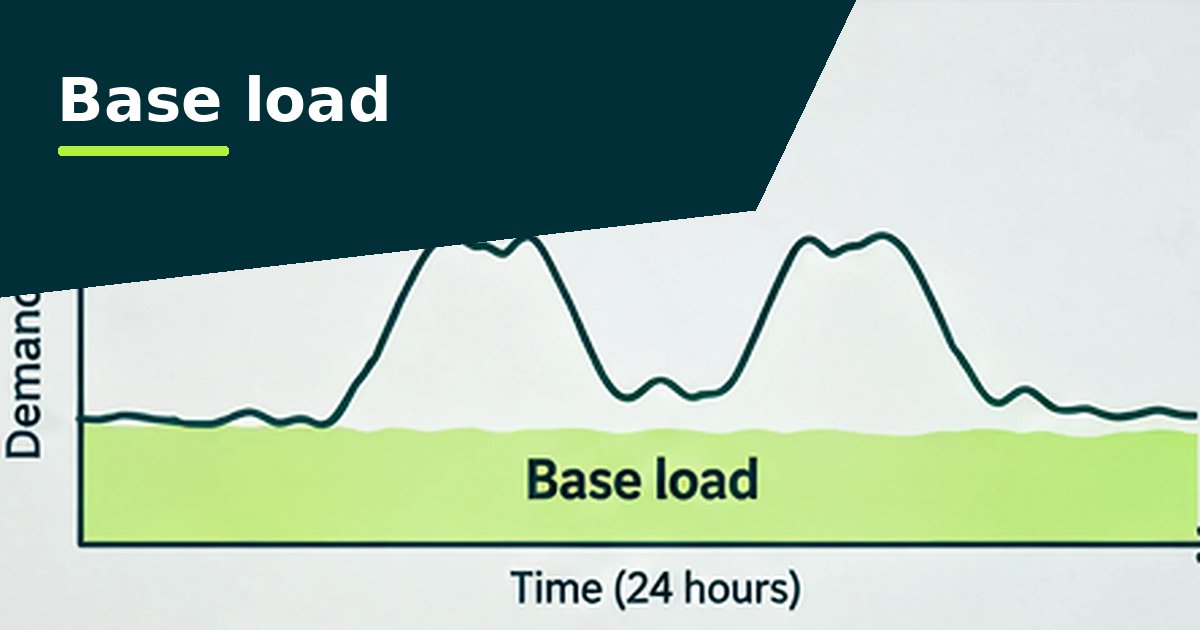
| Base load | 96.3 kW | The level demand rarely falls below across the whole year |
| Share that is base load | 63% | About £211,000 a year of continuous load |
| Busiest half hour | 288.6 kW | 16 July 2024 at 16:30, in a hot spell |
| Against supply capacity | 76% | About 304 kVA of a 400 kVA agreed capacity |
A hospital never closes, so there is no "out-of-hours" figure here. The 24/7 preset uses 01:00 to 05:00 as a low-activity window instead. On a site like this, the questions that matter are what's in the base load, whether it's moving, and how much room is left on the connection for heat pumps.
Finding 1: base load jumped in September and stayed up
The yearly base load of 96.3 kW hides a change. The base load by month chart shows it:
| Month | Base load | Month | Base load |
|---|---|---|---|
| Apr 2024 | 99.8 kW | Oct 2024 | 121.3 kW |
| May 2024 | 96.0 kW | Nov 2024 | 125.1 kW |
| Jun 2024 | 93.1 kW | Dec 2024 | 128.1 kW |
| Jul 2024 | 91.9 kW | Jan 2025 | 129.4 kW |
| Aug 2024 | 93.2 kW | Feb 2025 | 128.2 kW |
| Sep 2024 | 117.0 kW | Mar 2025 | 124.9 kW |
Between August and September the base load rose by about 24 kW. The weather barely changes between those two months, so this isn't heating. Some of the later rise is seasonal, but a step that size in one month points to something that started running and didn't stop.
The heatmap shows where: from 2 September, nights and weekends are darker (higher demand), while weekday daytime looks the same as before. In our made-up story, a controls upgrade over the summer left the theatre air handling units at full flow overnight and at weekends instead of setting back when the theatres are empty. HTM 03-01 treats switching off or setting back theatre ventilation when it isn't needed as the most energy-efficient policy, and NHS England's July 2026 estates bulletin on theatre energy puts the saving at 132 to 286 MWh per theatre a year, provided pressure cascades and temperatures are kept within limits.1
The extra is about 22 kW for around 5,700 hours a year, which is roughly 125,000 kWh, or about £31,000 a year at 25p/kWh if it's left running. It doesn't show up as an unusual day, because each day only moves a little. That's why the monthly base load chart is worth checking on every hospital site.
Finding 2: a short monthly dip that isn't a fault
On the first Tuesday of each month, demand drops to about 30% of normal between 10:00 and 11:00. That's the generator test: the site runs on its own generators and imports little from the grid. It sets the lowest half hour of the year (53.3 kW), but it's too short to drag the base load figure down, because base load is the 5th percentile across the year, not the minimum. If you see the same pattern in your data, check it against the generator test log before treating it as missing data.
Finding 3: summer sets the peak, winter sets the heat pump limit
The five busiest half hours all fell in the hot week of 15 to 19 July, when the chillers were working hardest. The peak of 288.6 kW is about 304 kVA at an assumed power factor of 0.95, which is 76% of the 400 kVA agreed capacity. Holding back a 10% margin leaves 360 kVA usable.
The largest constant load that fits in every half hour of the year is about 53 kW. But a heat pump runs mainly from October to April, when there's no cooling load, so the analyser's headroom test lets you check a load in the heating months only:
- A 100 kW heat pump, running around the clock from October to April, fits. The highest half hour with it added is about 354 kVA against 360 kVA usable. That's tight, with no room for anything else.
- A 150 kW heat pump doesn't fit. It would go over the usable capacity in 2,690 half hours on 154 days, by up to 46 kVA, mostly on winter weekday evenings. That needs a capacity increase from the network operator, a smaller heat pump, or controls that hold it back at peak times.
This is the check to run before you plan to replace gas boilers or a CHP engine with heat pumps. See electrical capacity on hospital sites and moving away from CHP.
Finding 4: it would use almost every unit of solar
Between 10:00 and 16:00 in summer, the site averages about 205 kW on weekdays and 147 kW at weekends. That's a lot of daytime demand to soak up solar. At UK average output (905 kWh per kWp a year), the analyser estimates:
| System size | Output a year | Used on site | Share of site's use |
|---|---|---|---|
| 299 kWp | 268,374 kWh | 99.8% | 20% |
| 449 kWp | 402,516 kWh | 95% | 29% |
| 748 kWp | 670,890 kWh | 76% | 38% |
| 1,196 kWp | 1,073,406 kWh | 54% | 44% |
Up to about 300 kWp, the site would use all of it. Most community hospitals don't have that much suitable roof, so for a site like this the limit is space and the grid connection, not demand. Car park canopies are often the way to add more. See solar on healthcare estates, then open the solar calculator from the analyser's Solar tab to cost a system.
What we'd do next
- Take it to the Ventilation Safety Group. The NHS England bulletin makes the trust's Ventilation Safety Group the starting point for any change to theatre ventilation, with the Authorised Person (Ventilation) on the project team. Then have the BMS contractor restore the setback. Then load the next three months of data to confirm the base load has dropped back (see proving a saving worked).
- Look for other continuous load. Even at 96 kW, base load is 63% of the bill. Walk the site at 02:00 with the night team: lighting in empty areas, pumps without variable speed drives, and plant left in hand. See base load on healthcare sites.
- Confirm the agreed capacity on the bill before planning any heat pump, and get the 150 kW option priced with and without a capacity increase.
- Size solar to the roof and car parks you have. On this profile, almost all of it would be used on site.
Questions people ask
Is this real data?
No. We made up the hospital and its readings so we could show the method without using anyone's real data. Every figure is what the analyser reports for the example file.
Why is there no out-of-hours figure?
Because a hospital with inpatients never closes. The 24/7 preset has no closed hours. Use the base load, its monthly trend and the low-activity window from 01:00 to 05:00 instead.
Can I run the same checks on my own hospital?
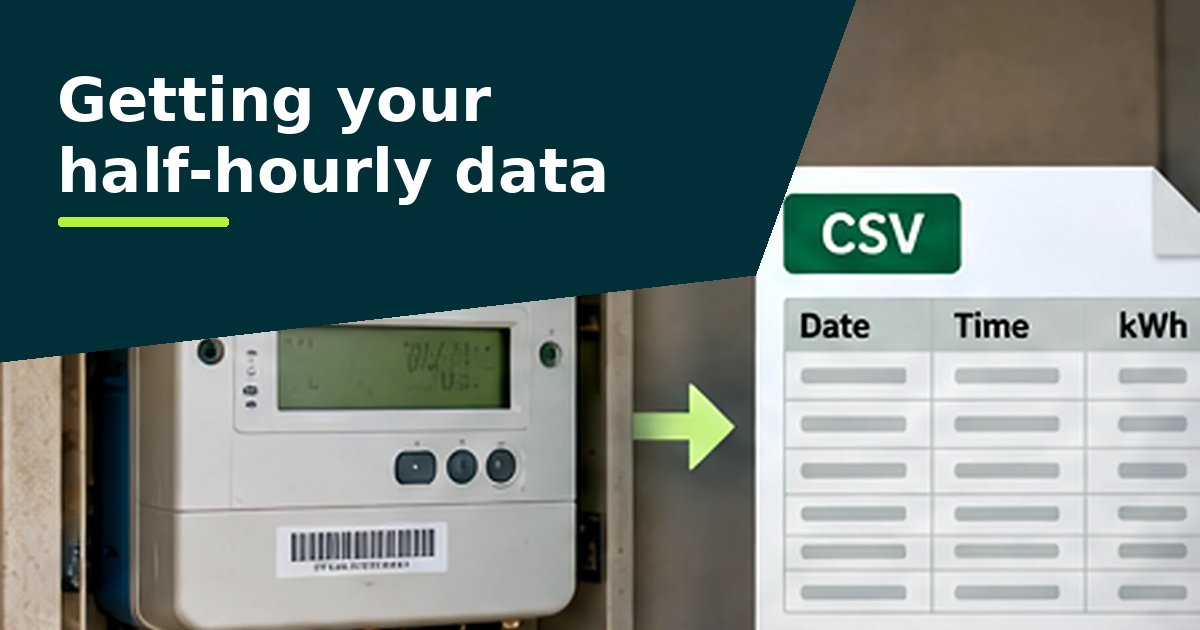
Yes. Ask your supplier for a year of half-hourly data for each main meter, load it into the analyser and enter your agreed supply capacity. It runs in your browser and nothing is uploaded.
Are these figures savings?
No. They're what each pattern costs now at 25p/kWh. A saving depends on what you change, and should be confirmed from the meter data afterwards.