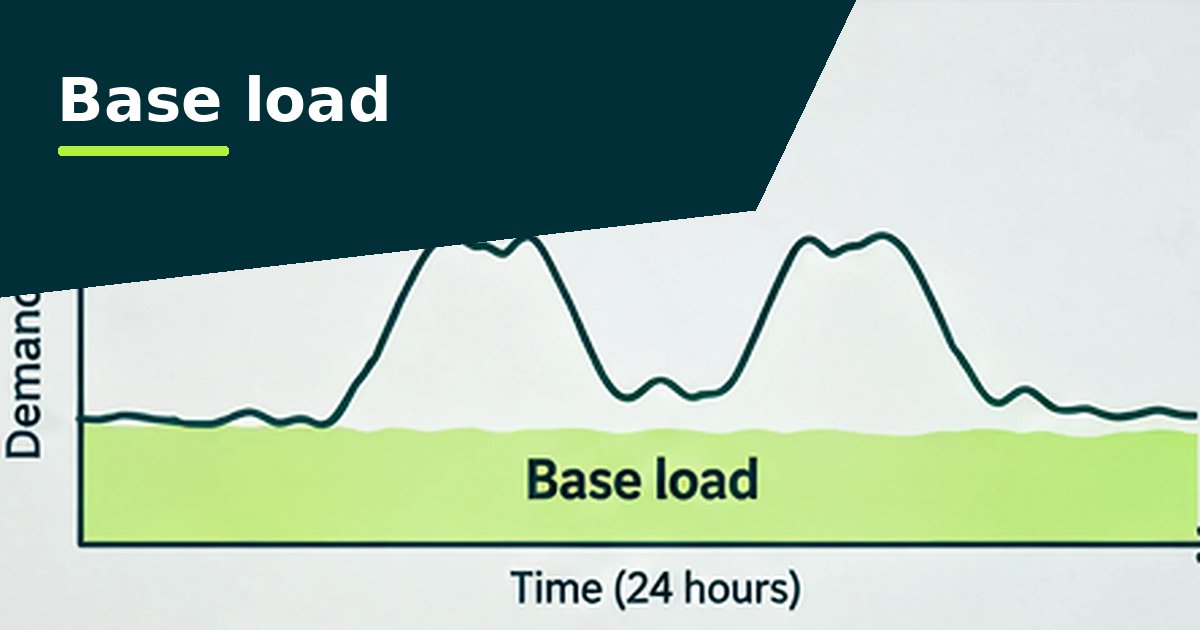
Compare a period before the change with a matching period after it, using the same types of day and four to eight weeks either side. Measure the part of demand the change should affect, such as nights and weekends for a ventilation setback, rather than the total bill. On a hospital, total consumption moves with activity, weather and new equipment, so a real saving can easily get lost in it.

Why it matters on healthcare estates
Grant-funded projects usually have to report what they saved, energy performance contracts pay on measured savings, and trust boards want evidence before funding the next phase. Even when nobody asks, checking the data is how you find out a setback was overridden or a timer reset after maintenance. The same check run monthly keeps savings from quietly drifting away.
Compare like with like
- Same types of day. Weekdays with weekdays, weekends with weekends. Keep bank holidays and the Christmas period out of both sides unless the change is about them.
- Enough data. Four to eight weeks either side usually shows a real change. One week can be thrown by a single unusual day.
- Close together. The nearer the two periods, the less the weather and seasons get in the way.
- Leave out the works. Skip the days when contractors were on site or plant was isolated.
- Write down anything else that changed, such as a ward opening, new imaging equipment or a CHP outage, so you can explain the result.
Measure the right thing
| Change | What to compare |
|---|---|
| Theatre or outpatient ventilation setback | Demand at night and at weekends, and base load by month |
| LED and sensors in 24-hour corridors and wards | The 01:00 to 05:00 low-activity window, plus daytime demand |
| Variable speed drives on pumps and fans | Base load, and demand in the hours the plant runs |
| BMS schedules in clinics and offices | Closed-hours excess, by type of day |
| Solar | Daytime import on sunny days against the solar estimate (imports should fall) |
| Heat pumps replacing gas boilers or CHP | Electricity rises, as expected. Measure the fall in gas alongside it, and check the new peak against capacity |
Weather and seasons
Chillers, electric heating and heat pumps follow the weather. If the before period was hotter or colder than the after period, some of the change is weather. For weather-sensitive changes, compare the same weeks a year apart as a cross-check, or adjust using degree days.
In the analyser
- Did a change make a difference? on the Base load tab compares matched weeks either side of a date you choose.
- Compare periods on the Heatmap tab puts any two periods side by side.
- Persistent changes on the Unusual days tab flags lasting shifts, so you can check the change appears when you'd expect it to.
When you need formal M&V
For an energy performance contract or a funded project with savings targets, agree a measurement and verification plan before work starts. The International Performance Measurement and Verification Protocol (IPMVP) sets out recognised methods: the baseline period, what gets adjusted for (weather, occupancy, operating hours) and how savings are reported. The half-hourly checks above are a good way to watch progress between formal reports.
Questions people ask
How long should we wait before checking?
Four to eight weeks after the change, compared with the same length of time before it, is usually enough to see a real change.
Why has the hospital bill not gone down after our project?
Activity, weather, prices and new equipment all move the total. Compare the specific part of demand the change should affect.
Our electricity went up after installing heat pumps. Did it fail?
Not necessarily. Heat pumps move heat from gas to electricity, so electricity rises. Judge them on total energy, cost and carbon, with gas included.
Can this replace a formal M&V report?
No. It is a good check, but formal measurement and verification, for example under IPMVP, agrees the baseline and adjustments up front.