See the kind of results the analyser produces before you find your own meter data. This is a made-up community hospital with made-up readings.
Made-up example. The hospital and its meter readings are invented, so nothing here is a real trust's result. Every figure is what the analyser reports for our example file, at an illustrative 25p/kWh and an agreed supply capacity of 400 kVA.
This made-up 60-bed community hospital used about 1.35 million kWh of electricity in a year, costing about £337,500 at 25p/kWh. Almost two thirds of it (63%) is base load, the demand that never switches off. From September that base load stepped up by about 22 kW when the theatre ventilation stopped setting back at night, which is worth roughly £31,000 a year to put right.
The year at a glance
One half-hourly meter, open around the clock, with 363 days of valid readings (99.5% coverage).
1,350,066 kWhelectricity a year, costing about £337,517
96.3 kWbase load across the year, 63% of all use
288.6 kWbusiest half hour, in a July hot spell
76%of the 400 kVA supply used at that peak
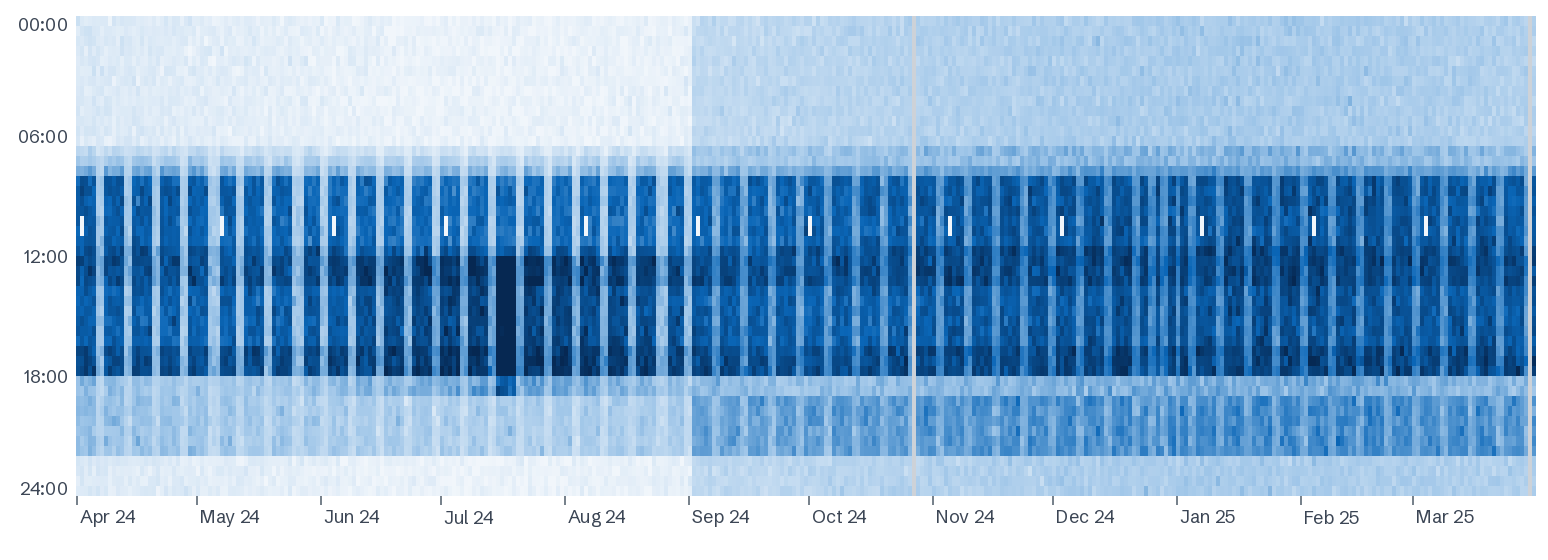
Every half hour of the year on one chart: one column per day, darker for higher demand. Nights never go pale on a 24-hour site. From early September they get darker and stay that way.
What the report shows
Base load trend
Base load stepped up in September
About £31,000 a year
Base load by month rose from 93.2 kW in August to 117.0 kW in September and stayed above 115 kW. The heatmap shows the extra load at nights and weekends only, about 22 kW for around 5,700 hours a year.
What to check: theatre and outpatient ventilation setback after the summer controls work, with the Ventilation Safety Group.
Capacity
Room for a 100 kW heat pump, not 150 kW
53 kW firm headroom
July chillers set the year's peak, leaving 53 kW of constant headroom within a 10% margin. Tested over October to April only, a 100 kW heat pump fits (354 kVA of 360 usable); a 150 kW one goes over in 2,690 half hours.
What to check: the agreed capacity on the bill, before any heat pump design goes further.
Solar
Almost all solar would be used on site
99.8% at 299 kWp
At UK average output, a 299 kWp system would generate about 268,000 kWh a year and the hospital would use 99.8% of it, covering 20% of its electricity. At 449 kWp it would still use 95%.
What to check: usable roof and car park area, then open the solar calculator from the Solar tab.
The base load itself is separate from these: 96.3 kW running all year is about £211,000. On a hospital, most of it has to run, but every kilowatt removed is worth about £2,190 a year.
A dip that isn't a fault
On the first Tuesday of each month, demand falls to about 30% of normal for an hour mid-morning. That's the on-load generator test, when the hospital runs on its own generators. It sets the lowest half hour of the year (53.3 kW) but doesn't drag the base load down, because the analyser uses the 5th percentile rather than the minimum.
What could actually be saved?
The figures are what each pattern costs now, not a promised saving. To turn them into one:
Take the base load step to the Ventilation Safety Group and have the setback restored by the BMS contractor.
Walk the site between 01:00 and 05:00 with the night team and list what's running in empty areas.
Change one thing at a time, so each change shows up clearly in the data.
Compare matched weeks before and after with the analyser's before-and-after view, for a measured saving rather than an estimate.